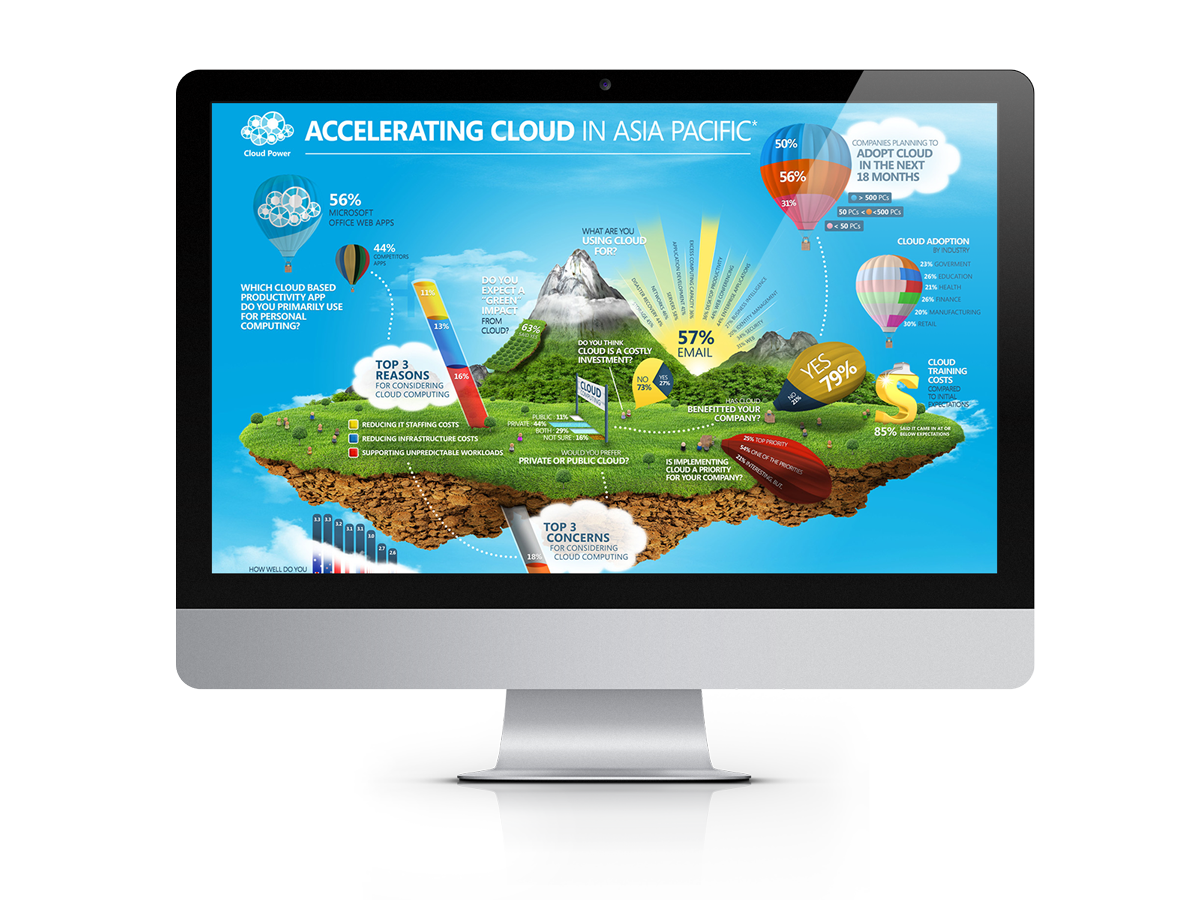
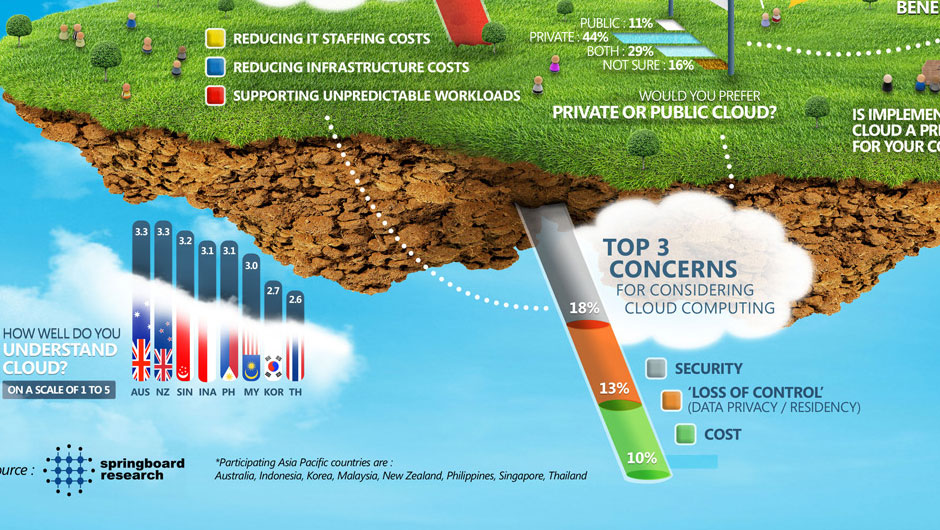
We had to consolidate findings, cull data, define a line of story, prioritise information, sketch, set type, arrange info positions, tweak artwork, before arriving at the final infographic.
- January 28, 2015
Background
The coming of age for Cloud computing offered Microsoft an opportunity to demonstrate their expertise on the subject. They commissioned an industry study by analyst firm Springboard to send out the following key message: “Cloud solutions and platforms are a viable infrastructure to combat IT challenges – and here’s the proof”.
Challenge
Using only raw findings from the earlier study, our challenge was to translate those unfiltere data into a simple visual perspective for a broad audience.
Approach
After a great deal of time processing the data, we drew inspiration from the relationship between clouds and man, and built on the familiar metaphor of a hot air balloon’s journey up into the heights. From preparation to ascension, the journey mirrors the increase in a company’s efficiency, growth and value. The resulting infographic gives compact insights of Cloud technology and Microsoft’s capabilities, in a clear and relatable narrative.
Results
At a time when infographics were the emerging rage, there was not a lot of precedence to learn from. So between my Senior Designer and myself, we attempted several concepts. The final artwork was loved by the client and it reaped us more business in this discipline.
Meta
Year: 2011
Client: Microsoft
Role: Creative Director, Wunderman
Team: 1 Senior Designer
- digital
- team lead


